Measuring performance is a recognized pathway to success in motorsports. It stands to reason therefore that when permitted by regulations, race teams will always seek to maximize instrumentation and data acquisition. Formula 1 teams are the undisputed leaders of the pack in the world of racing in this area, extracting thousands of measurements from each vehicle and collecting hundreds of terabytes of data per event. It is reported that F1 teams at the 2014 US Grand Prix collected about 243 terabytes of data – just a little less than the total information stored in the US Library of Congress. Surely this must be enough information to understand a handful of cars quite well, correct? Well, yes and no.
How’s and Why’s
There is an ever-present maxim at play in all levels of racing: It is better to lose a race and know why than it is to win and not know why. Of course, the availability of information alone does not lead to the Great Knowing. Nor does the application of a robust layer of data analysis. Nowadays, just as always, true understanding can only be achieved by asking the correct questions. In fact, in this day and age of “big data” asking the right questions is perhaps even more important than ever. And more difficult. Too much information can easily result in a case of ‘analysis paralysis.’
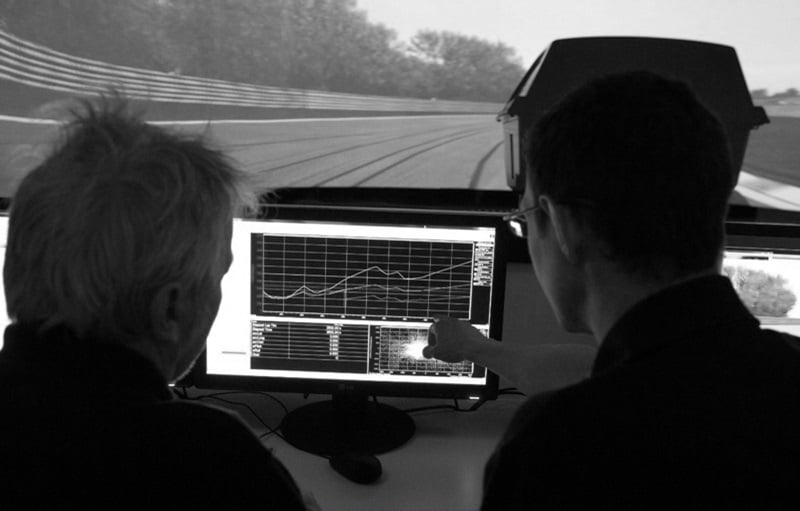
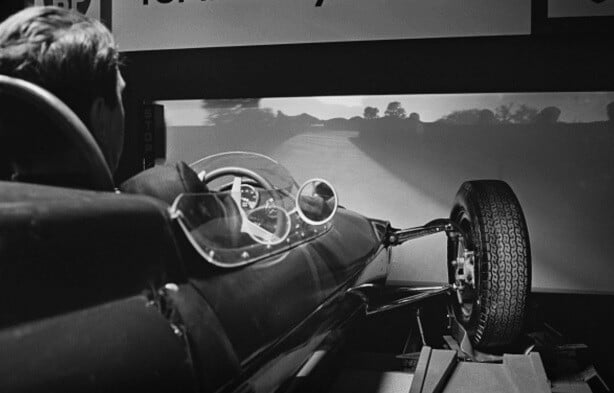
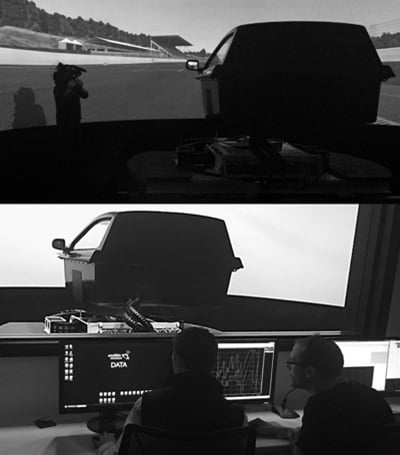
Every racing team in every series has developed its own ways to scrutinize its available data. Here at Ansible Motion, the same is true. Since we are dealing with Driver-in-the-Loop simulators, we have a few advantages, it is true. For example, we control the weather and track conditions rather than oblige them. And we have the luxury of changing tires with key strokes rather than wrenches. Nonetheless, we discover things here and there, and we use these discoveries to make improvements. Here are four items – drawn from the myriad that could be scrutinized – that we find to be particularly helpful on our Delta series DIL simulator at our factory R&D Centre in Hethel, UK. Perhaps these might be helpful outside a DIL laboratory, out in the real world.
Control tasks
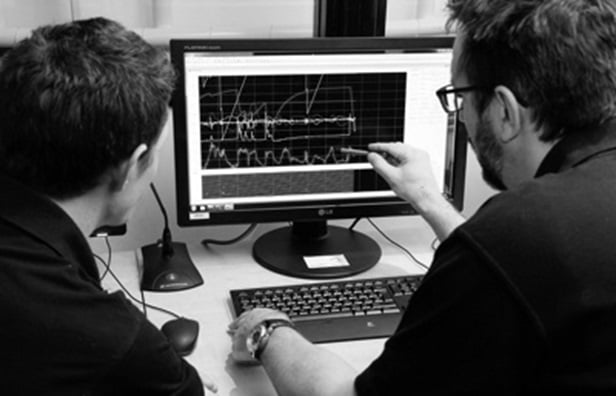
The ‘busy-ness’ of the primary driver control task traces (steering, throttle, and brakes) during a lap can reveal volumes about how a driver is managing the stability of a vehicle. There are a number of ways to quantify this data, such as analyzing the deviation of task traces versus idealized (smooth) representations of the same from, say, a lap time simulation, or by looking at task content in the frequency domain. Since the total number of driver control channels is small, this approach can bring focus to what might otherwise be an overwhelming array of data analysis possibilities.
Segments
The relationship between segment times and overall lap times is worth a close look. One can divide almost any track into segments and compare each segment time versus overall lap time. If tuning changes are made to the car, there may be corresponding reductions (or increases) in lap times that correspond almost directly with particular segment times. This can help identify which specific track segment gains have the most to offer in terms of making overall gains. And those track segments may, in themselves, have obvious characteristics that help narrow the scope of vehicle tuning explorations.
Vectoring
As we know, vectoring is the relationship between forward velocity and side velocity, applied to the car or to individual tire contact patches. It is simple enough to measure gross forward velocities (usually), but side velocity measurements are usually not direct or practical on real cars on real racetracks. However, vectoring can be easily "measured" and analyzed with a capable Driver-in-the-Loop (DIL) simulator, which has access to all physics channels that are needed to calculate the vectoring metrics. It is also worth noting that the driver’s interaction with vehicle trajectory can also be examined in a DIL simulator. Since this information feeds most vehicle stability characterizations (traditional ones and clever variations), it stands out as "must have" data in the swirl of other available channels.
Bio-telemetry
Human physiology measurements can certainly be acquired during a race, but a driving simulator can offer a special viewing window into this realm. It is not just a simple matter of measuring where a driver is looking on a racetrack, or monitoring a heart rate or other metrics and having these available as additional telemetry or recorded channels. DIL simulator experiments make it possible to map physiology measurements against specific scenarios and come to an understanding of the intricate relationships involved. Much as it's useful to know the time lag relationship between lateral acceleration and yaw rate, it can be quite useful to know the lead / lag relationship between certain driver metrics and event onsets.
In addition, certain measurements can provide insight into a driver’s cognitive workload while performing specific tasks. A practical example might be analyzing driver/engineer communications and quantifying the level of distraction / disturbance at particular areas on a track in order to establish “no talk zones.” Physiological measurements gathered in a safe environment such as a DIL simulator lab can also help determine the effects of driver fatigue during endurance events such as the 24 Hours of Le Mans, thus helping to optimize features in the car to improve performance and safety. Just as is the case with vehicle measurements, there are many, many possibilities in the area of driver measurements – but there are always a few that come to stand out as key indicators of human-machine interaction.
Are you interested in reading more about solutions to motorsports simulation challenges? If so, you can download our FREE eBook, Engineering the advantage: Driver-in-the-Loop simulation in motorsport.

